


New York City has 193 neighborhoods, so you can sort voter counts from L2’s latest voter file by different voter categories. Work with these data today on L2 DataMapping, sign up HERE
Most Voters: Upper West Side (Manhattan), most voters 84.8K
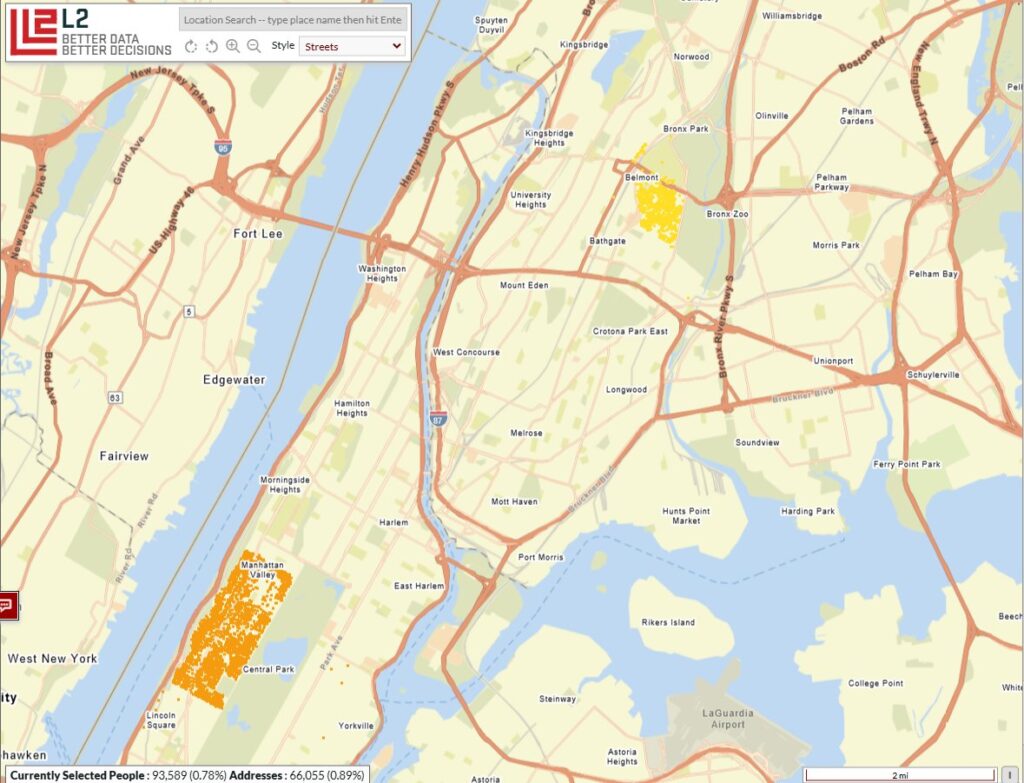
Belmont (Bronx) has the smallest number of voters 9K
Most Registered Democrats by percentage of the district:
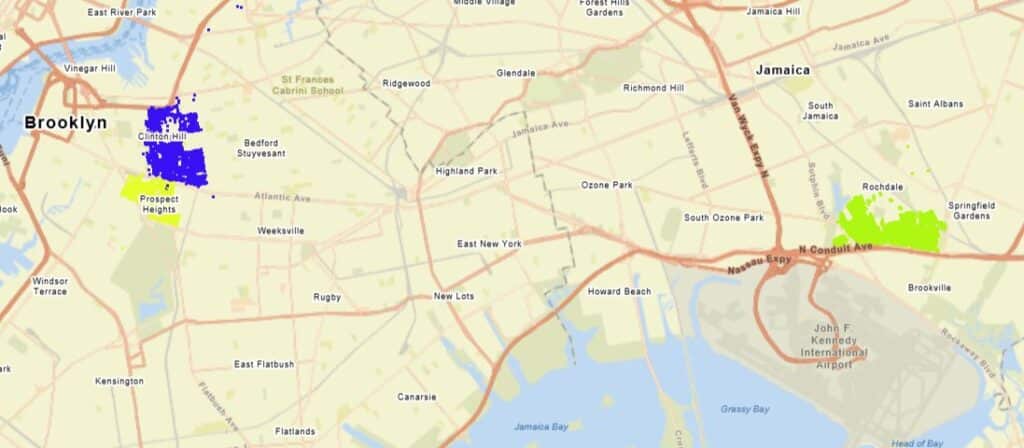
Prospect Heights (Brooklyn) 83% D
Springfield Gardens (Queens) 82% D
Clinton Hill (Brooklyn) 81.7% D
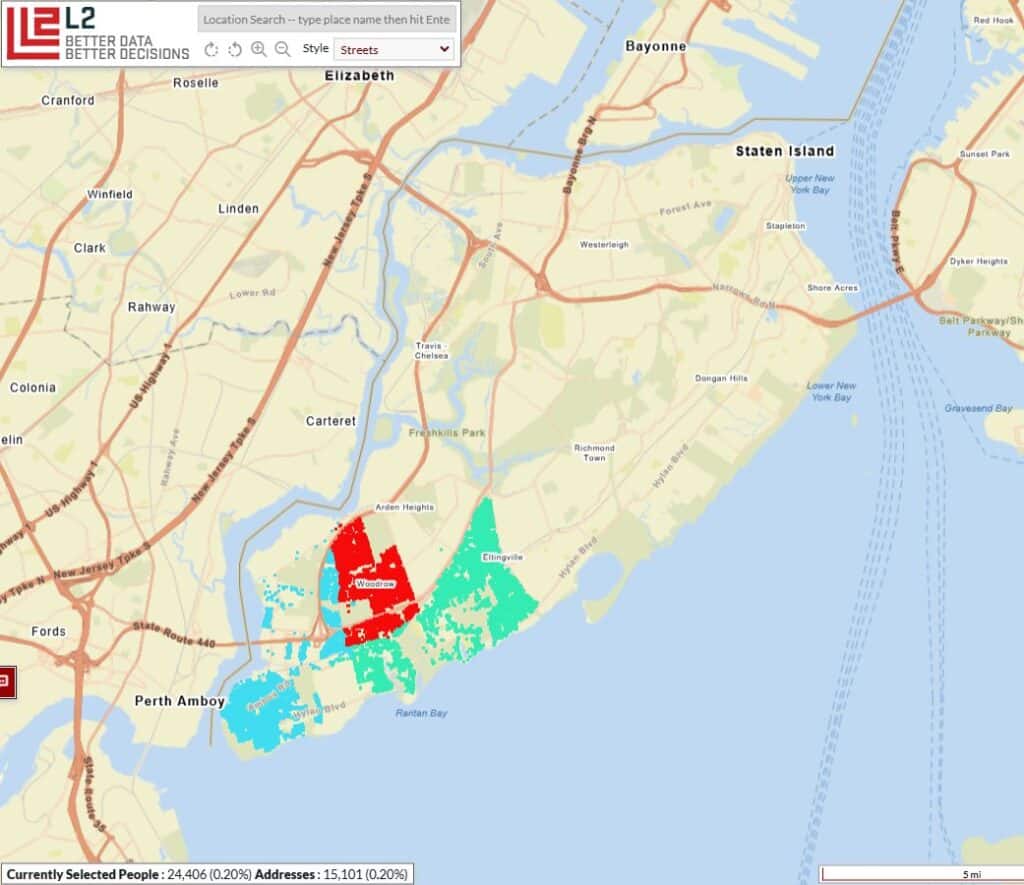
Most Republicans by percentage in NYC (neighborhoods are all on Staten Island):
Charleston Richmond Valley 48.6% R
Rossville Woodrow 47% R
Annadale-Huguenot-Prince’s Bay 46.3%
Neighborhoods with the most young (18-34 year old) voters as a percentage:
North Corona (Queens)(14%)
Borough Park (Brooklyn)(11%)
Port Richmond (Staten Island) (10%)
Neighborhoods with the most older (65+) voters as a percentage:
West Brighton (Brooklyn) 48%
Brighton Beach (Brooklyn) 41%
Ft. Totten-Bay Terrace (Queens) 39%
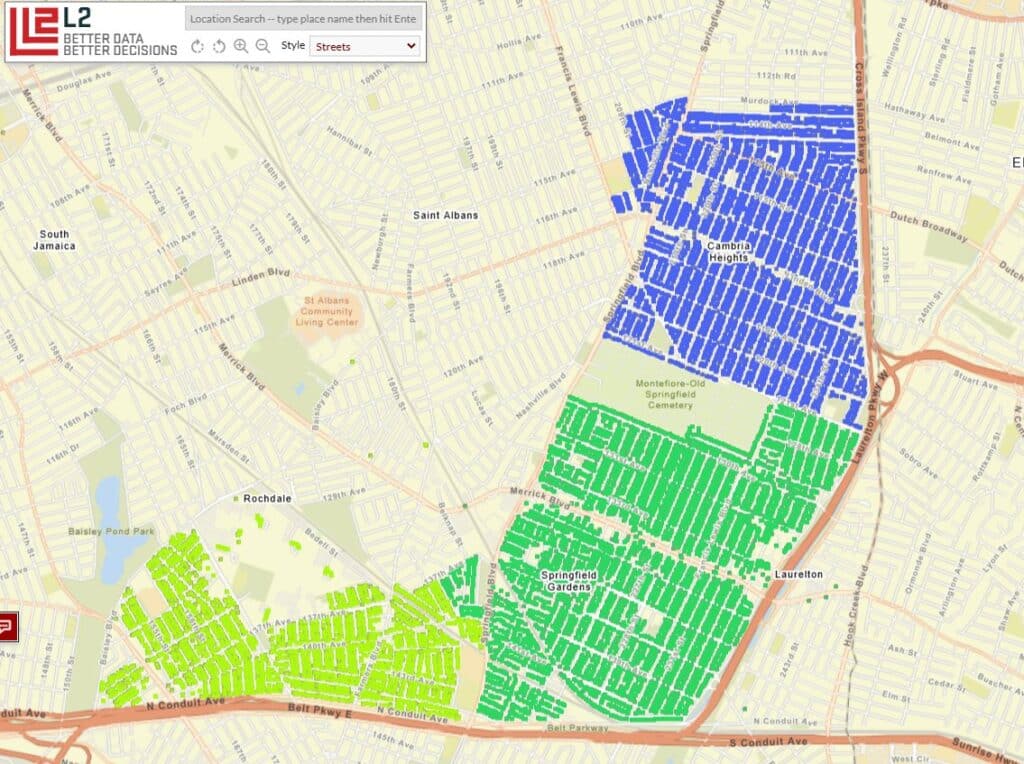
Most Non-White Voter Neighborhoods:
Springfield Gardens North (Queens) 92%
Laurelton (Queens) 91.9%
Cambria Heights (Queens) 91.8%
Ethnic Breakdown: 85% African American, 5% Hispanic, 1.3% White
Highest Voting Performance Using L2’s Score of 75%+ based on a voter’s lifetime vote history:
Stuyvesant Town-Cooper Village (Manhattan) 55.5%
Brooklyn Heights (Brooklyn) 55%
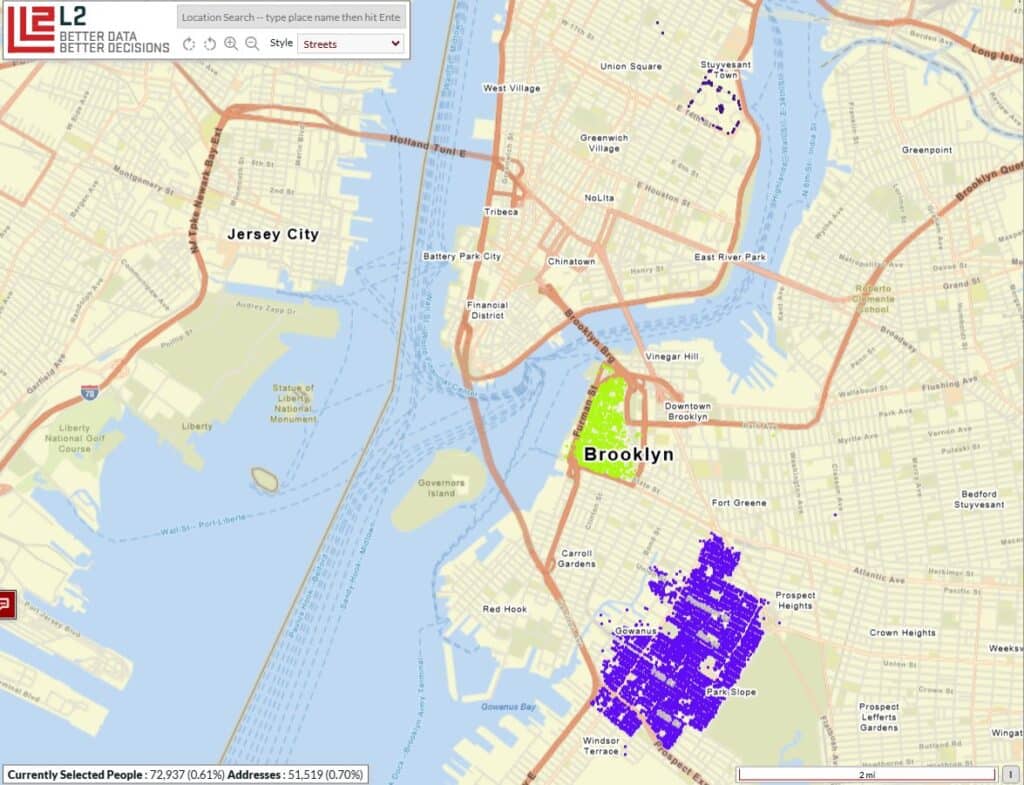
Park Slope-Gowanus (Brooklyn) 54%