


L2 provides known and modeled party affiliation in all 50 states and Washington, D.C. A majority of states provide party affiliation based on registration; in the remaining states L2 uses a combination of primary ballot selection and demographic modeling to fill in blanks based on a breadth of known information.
In Texas, L2 utilizes this latter method. In an Open Primary State like Texas, a voter can choose in which party's primary he or she would like to vote. Primary ballot selection by itself is not a definitive indicator of party preference; however, it has proven time and again to be a strong indicator, particularly for even year primary elections.
In the state's most recent statewide primary, the March 2024 Presidential Primary, approximately 19.1% of the state's registered voters participated. This low turnout leaves a large number of voters without any primary ballot selection, so we look back in time at past primary vote histories. Examining the entire voting history of all Texas voters over their lifetime, approximately 7.2 million voters, or 41.1% of the electorate, have participated in a primary at some point in their lives. This provides us with a larger look at the likely partisanship of the electorate but still less than half.
Among the group of those who selected a primary election ballot at some point in their vote history, 56.1% are likely Republican, while 43.8% are likely Democrat based on their primary ballot selections.
Nearly 60% of the electorate has not voted in a primary that can be used to identify likely party affiliation. To address this, L2 models this portion of the electorate using a variety of data. This includes leveraging a wealth of demographic information, voting history, consumer data, donor information, racial and ethnic coding, urbanicity (urban, suburban, or rural), age and other relevant data to create statistical models.
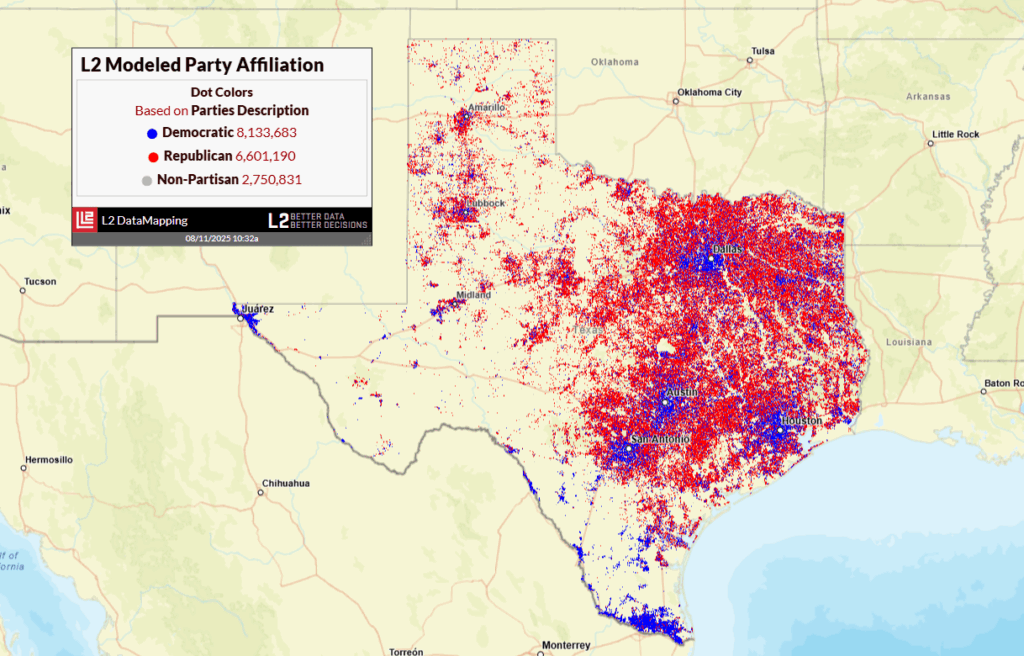
Utilizing both the primary history and these demographic models, we divide the voters into three categories: Likely Democrat, Likely Nonpartisan, and Likely Republican. As of August 11, 2025, L2 has the following counts by likely party affiliation:
- Likely Democratic: 8,133,683 (46.5%)
- Likely Non-Partisan: 2,750,831 (15.7%)
- Likely Republican: 6,001,190 (37.7%)
This may surprise many who are outside the political and research spheres, as Texas has long been considered a "red wall" state. Here's how it is possible for Texas to have more likely Democrats than likely Republicans…
Registration Doesn't Equal Turnout: Both inside and outside Texas, candidates from one party can perform well in a state where a larger number of registered voters from a different party are likely to vote. Of those who voted in the 2024 general election in Texas, L2's modeling indicates that approximately 42% of voters were likely Democrats, 10.7% were likely Nonpartisans, and 47.1% were likely Republicans. This suggests that, despite the modeling of the overall electorate favoring Democrats, the actual voter turnout reflected a greater number of Republicans. In that election, President Trump won with 56.2% of the vote, compared to Vice President Harris's 42.4%. Furthermore, final vote percentages in an election don’t always reflect party turnout. It is difficult to know how independent/nonpartisan voters will vote in an election and it is always the case that modest numbers of voters registered with one party will vote for a presidential candidate of the opposite party.
Additional Notes on Race and Ethnicity: As noted above, statistical modeling takes into account various factors, including racial and ethnic coding. In Texas, we have access to some racial coding data, but we also rely on modeled information. The significant growth in the Hispanic population in Texas has shaped the electorate, with approximately 25.4% of voters identifying as Hispanic and another 4% who declined to state race but who, based on name analysis, are likely Hispanic. African-Americans represent 7.7% of all voters. (Note that both of these groups register in lower percentages than white voters so these percentages are lower than the Census Bureau estimates for the total population in Texas. In addition, where race is not selected on registration forms it is particularly difficult to identify likely African-American voters.) While there has been much discussion about a shift among young Hispanic and African-American men toward Republican candidates, the overall primary ballot selection among Hispanics and African-Americans still favors Democrats, strongly in the case of the latter. Among likely Hispanic voters with a history of participating in primary elections, approximately 69.4% are likely to identify as Democrats, while 30.6% are more likely to identify as Republicans. The numbers are even more striking among likely African-American voters, with 83.1% pulling a Democratic ballot compared to 16.8% pulling a Republican ballot. In urban areas, these percentages increase even further in favor of Democratic primary ballot selections. (For a particularly good discussion of these issues see the following article by Pew Research How voting patterns changed in the 2024 election: A detailed analysis | Pew Research Center.)
Texas Partisan Realignment: Based on a 2025 definition of Republicans and Democrats, Texas voters who turnout in statewide elections tend to be more Republican. This shift, often referred to as a turning point, really began in 1980 when Ronald Reagan won Texas by a substantial margin, but the change hadn't taken full effect. Democrats dominated all statewide offices until the 1994 elections, when Republicans won every major race and have maintained control of these offices ever since. Republicans gained control of the Texas Senate in 1997, and they took control of the Texas House in 2003 for the first time since Reconstruction.
Summary: At L2, our goal is to provide users with the most accurate and up-to-date information. As a nonpartisan organization with over 50 years of experience in the field, L2 aims to provide the most comprehensive view of the electorate and enable our users to work with that data. Our thousands of users, ranging from local elected officials to major campaigns, media organizations, universities, and researchers, depend on the timeliness and accuracy of the information we provide. Despite our extensive experience, modeling remains an inexact science, and it's essential to understand the limitations associated with using modeled data in the assignment of party affiliation.
For More Information Email: paul.westcott@L2-data.com
