


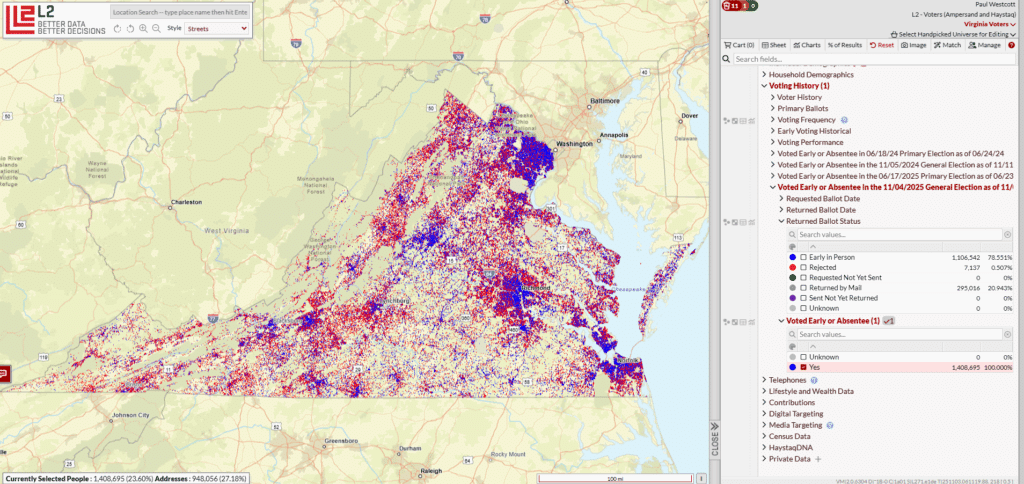
As early voting wraps up in Virginia, demographic data offers a revealing look at who’s shaping the state’s political direction. According to recent figures from L2, nearly 1.4 million Virginians have already cast their ballots — a group that reflects the state’s mix of urban growth, suburban stability, and rural tradition.
Women make up the majority of early voters (55%), continuing a consistent trend in recent Virginia elections. In terms of party alignment, Democrats lead the modeled party identification* edge at about 56%, while Republicans hold just over 38%, with a small independent or non-partisan slice rounding out the electorate.
Age is the defining factor among Virginia’s early voters: almost half are over 65, and another fifth are between 55 and 64 — meaning roughly two-thirds of the ballots come from voters 55 and older. Younger Virginians (under 30) account for less than 7% of early voters, showing that older demographics continue to dominate turnout.
Virginia’s early electorate also reflects meaningful ethnic and cultural diversity. Voters of European ancestry make up just under 70%, with African-Americans (13%), Hispanics (4%), and Asians (3.5%) forming important blocs. Suburban residents — particularly in Northern Virginia and Richmond’s surrounding counties — represent nearly half of early voters, underscoring the state’s shifting population patterns.
Overall, the data suggests Virginia’s early voter base is older, more female, and more suburban than the general population — a mix that could shape the state’s outcomes well beyond Election Day.
*Note L2’s Virginia party ID: Because Virginia does not register voters by party, L2 models Party ID through a predictive approach that blends behavioral, demographic, and attitudinal data. The model uses factors such as past primary participation, contribution records (e.g., ActBlue vs. WinRed), issue positions, media consumption, and neighborhood-level voting patterns to estimate each voter’s likely affiliation. These inputs are scored to assign a partisan probability and a modeled Party ID label — Democratic, Republican, or Non-Partisan. The system is regularly validated against new election results and contribution data to ensure accuracy over time.
